by Randy Frank, Contributing Editor
Many applications use pressure sensor measurements to calculate other key parameters such as flow, altitude, water column height, fluid depth, weight and more. In industrial applications, the most common use of pressure sensors to calculate another parameter is flow.
In fluid flow applications, several factors determine the pressure drop that occurs including the flow velocity, kinematic viscosity, laminar versus turbulent flow, Reynolds number of the fluid and internal roughness of the inside of the pipe as well as its diameter, length and form factor. Orifice plates, venturi tubes and nozzles simplify the situation. In these cases, the flow is related to ΔP (P1-P2) by the equation:
q = cd π/4 D22 [2(P1-P2) / ρ(1 – d4) ]1/2
Where:
q is the flow in m3/s
cD is the discharge coefficient, the area ratio = A2/A1
P1 and P2 are in N/m2
ρ is the fluid density in kg/m3
D2 is the orifice, venturi or nozzle inside diameter (in m)
D1 is the upstream and downstream pipe diameter (in m)
and d = D2/D1 diameter ratio
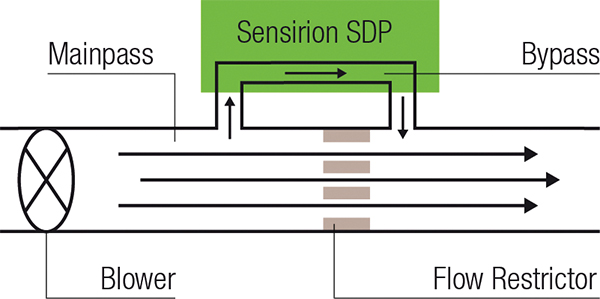
Sensirion’s SDP3x differential pressure sensor can be used to measure air flow in industrial applications including sensing air flow in air ducts. Using a bypass channel, the micro-thermal sensor provides reliable air flow measurements for preventive system maintenance including alerting users of the need for air filter replacement.

According to Bernd Zimmerman, field application engineer, Sensirion, “The sensor itself has two posts and can be incorporated into a flow tube to measure bi-directional airflow.”
Silicon Microstructures’ SM9543 is an ultra-low pressure sensor commonly used in air flow applications.
“With a rated differential pressure of 2-inches H2O, the SM9543 is suited to measure the air flow of blowers, air flow through filters, vent hoods, gas boilers, or in use for HVAC VAV (variable air volume) controllers,” said Omar Abed, President and CEO of Silicon Microstructures. “This ultra-low pressure sensor is very stable and has been demonstrated to correlate pressure drops to flow rates in the range of 50 to 300 slm (standard liter per minute) with properly designed systems.”

Other flow sensing measurements use pressure sensors but have a rather different approach.
For example, blower door testing checks the integrity of the room seal for energy usage efficiency to avoid heating or cooling losses. This application uses the pressure sensor as a flow/leak detection measurement device—in conjunction with a variable-speed fan mounted to an opening such as a door or window.
An industrial application of the process is in clean rooms, where efficient operation of the integrated ventilation system is required. In fact, a standardized Blower-Door-Test is provided in ISO 9972:1996 and in the Deutsche International Norm DIN EN 13829:2001-02.
According to ASTM Standard E779-87, Test Method for Determining Air Leakage by Fan Pressurization from the American Society of Testing and Materials (ASTM), the effective leakage area (ELA) is calculated by:
ELA = CBuilding * √(ρ/2)*ΔPRef* exp(nBuilding-0.5)
Where: ELA = Effective Leakage Area (m2 or in2)
CBuilding = Building air leakage coefficient
ρ = Air density (kg/m3 or lb/in3), typically a standard density is used
ΔPRef = Reference Pressure (Pa or lbForce/in2), typically 4 Pa in US and 10 Pa in Canada
nBuilding = Building pressure exponent
In clean rooms, leakage can cause major problems. For this type of application for one customer, All Sensors uses a derivative of its DLVR-L04G-E1BD-C-NI3L.

“The customer requires the best possible noise-free resolution to accomplish their measurements,” said Tim Shotter, Director of New Product Planning at All Sensors. “In order to satisfy their requirements, we used a 2-inch H2O assembly and ranged it to ± 4-inches H2O. This provides the highest signal to noise ratio available for their application.”
Determining temperature from ΔP
Air cooling systems provide another example of pressure used to determine another system parameter. Superheat refers to the number of degrees a vapor is above its saturation temperature (boiling point) at a particular pressure.
“Superheat is determined by taking the low side pressure gauge reading, converting that pressure to temperature using a pressure temperature (PT) chart, and then subtracting that temperature from the actual temperature measured (using an accurate thermometer or thermocouple) at the same point the pressure was taken,” said Gary Winzeler, Director, Sales & Marketing, DunAn Sensing.

With a superheat value, users can increase or decrease the superheat and reduce the time and energy to achieve a desired system temperature. For this application, DunAn Sensing developed a specific pressure transducer that would meet all the requirements of the HVAC/R marketplace.
“Refrigeration for product storage in a food processing plant is a typical industrial application for superheat pressure measurements,” said Tom Ngyen, CEO, DunAn Sensing.

Measuring dynamic phenomenon with pressure sensors
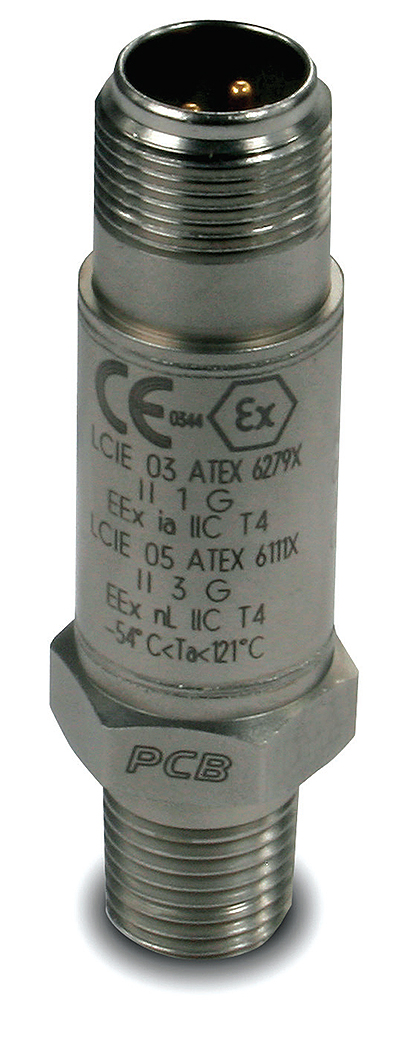
Ken Watkins, Technical Sales Specialist of PCB Piezotronics, Industrial Div., IMI Sensors provides another alternative approach for sensing pressure in flow applications. His company’s piezoelectric pressure sensors are specifically designed to measure dynamic phenomenon. These events occur in a relatively short period of time. In fluid transmission applications in a factory or other environment, an intrinsically safe pressure sensor such as the 121A44 provides an interesting measurement.

“It’s a pressure sensor but what it’s measuring is frequency content,” said Watkins.
With the bandwidth of the piezoelectric pressure sensor, noise from fluid moving in a pipe can be measured. For example, the frequency spectrum of the flow could have most of the noise around 5 kHz. With a valve in the line, changing the position of the valve produces a different acoustic signature because of the gap or constriction added to the flow.
“There are eddy currents on the back side of the valve, for example, that would cause different frequency content or multiple frequency points,” said Watkins. “You might have the basic flow at 5 kHz, but then you might have smaller higher frequency signals that could tell you something about the valve position or if you have a leak. If the valve is closed and you still have an acoustic signature, there is a leak.”
Similar to monitoring a bearing in a rotating structure, during normal operation there is a desired spectral pattern. When a failure such as a crack in the bearing occurs, there is a totally different signature. With a thorough failure mode effects analysis (FMEA), specific types of signatures can be identified and detected by a digital signal processor (DSP) or other computing device.
“All they are looking at is a relative measurement in dB or log/log. You’re not looking at pressure,” said Watkins. “You’re looking at where that frequency is and did it move relative to where it was before—did it change from the norm. It’s more like frequency trending.”
Managing quality with pressure readings
While they are not related to flow, pressure sensors can also be used for inferred measurements. Pete Smith, Senior Manager of Product Knowledge & Training for TE Connectivity, recalled a production line situation that he was intimately involved in during his career and prior to working for TE Connectivity.
“They had these pneumatic screw drivers,” said Smith. “In other places, they had presses that would push parts together where they could use ultrasonic welding or put rivets into things. They were all pneumatically-powered pieces of equipment.”
With a pneumatic screw driver, an accurate torque setting typically is a function of the pressure applied to the screwdriver.
“We would monitor the pressure for all of our air supplies to all of these production work stations and it became a quality control tool,” he said. “By monitoring the air pressure, we were able to determine if the tool was operating properly.”
Because an air production line is typically between 50 to 100 psi, TE Connectivity’s model M5200 industrial pressure sensor with a pressure range of 0-100 psi can be used for this application.
“If factories aren’t monitoring the air pressure in their systems, they’re missing out. They’re not doing something right,” said Smith. “It’s one of the parts of a factory infrastructure that people should be looking at.”

As the Industrial Internet of Things (IIoT) and smart factories get implemented, Smith sees a vital role for these types of pressure measurements.
“It turns out that creating the smart factory is not that easy,” he said. “It’s actually very hard because you not only have to marry all the equipment in your factory to your factory infrastructure, the water electricity, compressed air, and environment including lighting, but you have to get all these thing talking to each other. You have to get the factory floor to talk to your air compressor that’s part of the building infrastructure.”
Sensors are an integral part of the solution.
“The ultimate objective of the smart factory is to incorporate all the data that all these machines produce and all that the factory infrastructure produces into an analytics program capability,” said Smith. “The analytics are going to manage the factory from front to back.”
Smith concluded, “The sensors that we’re talking about here are going to be some of the nodes that provide data for that analytical capability.”
Based on the data from pressure and other sensors and measurements later in production or quality control, manufacturers have even better capability to correlate process changes to acceptable and unacceptable results.
All Sensors
www.allsensors.com
DunAn Sensing
www.dunansensing.com
PCB Piezotronics, Industrial Div., IMI Sensors
www.pcb.com
Sensirion
www.sensirion.com
Silicon Microstructures
www.si-micro.com
TE Connectivity
www.te.com
