While discrimination based on skin color is against the law in the U.S., changes in skin color provide important information in healthcare regarding disease progression or treatment response, so accurately measuring and distinguishing skin color is essential. Skin color is also a predictor of skin cancer risk. Also, accurately measuring and matching skin color is important in cosmetics. Several factors including melanin (terminology for natural pigments), blood flow, skin thickness and photoaging contribute to an individual’s skin color. Differentiating between skin tones and colors is the goal behind a variety of color scales.

The Fitzpatrick scale is one of the longstanding benchmarks for skin color identification. Also known as the Fitzpatrick skin typing test or Fitzpatrick phototyping scale, it is a numerical classification schema for human skin color that identifies six categories of skin types. Developed in 1975 by American dermatologist Thomas B. Fitzpatrick, it is a way to estimate the response of different types of skin to ultraviolet (UV) light for skin phototype (SPT) categories that are based on sun reactiveness and not the same as skin color.
In 1976, the Commission Internationale de l’Eclairage (International Commission on Illumination (CIE)) developed the CIE 1976 L*a*b* colour-difference formula (ISO/CIE 11664-4) for color communication. Also referred to as CIELAB, the CIE 1976 L*a*b* color space is widely used today in many industries for color control and management.
In the L*a*b* color scale, L* indicates lightness and a* and b* are chromaticity coordinates. Color directions a* and b* are defined as: +a* is the red axis, -a’ is the green axis, +b* is the yellow axis and -b* is the blue axis. Another key definition includes the individual typology angle (ITA) that measures constitutive pigmentation.
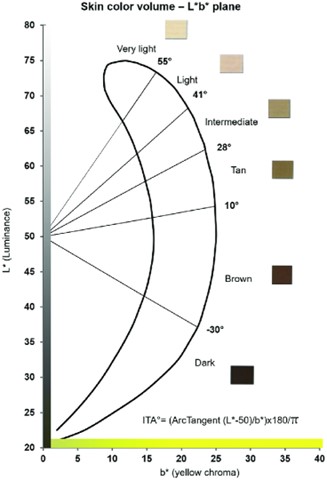
The ITA of the corresponding skin color can be obtained from the L* and b* values according to the formula. The color patches represent average skin colors for each color group that match the L’Oréal Skin Color Chart. While it is a cosmetics company, L’Oréal developed the chart to provide a deeper understanding of the biological mechanisms to counter aging and sun damage.

L’Oréal Group Skin Color Chart.
Similar to L*a*b*, the CIE L*C*h color space is used because it correlates well with how the human eye perceives color. In the L*C*h color space, L* indicates lightness, C* represents chroma and h is the hue angle. The value of C* is the distance from the lightness axis (L*) and starts at 0 in the center. The hue angle starts at the +a* axis and is expressed in degrees where 0° is +a* or red and 90° is +b, or yellow.
One of the much earlier skin color scales is the Von Luschan’s Scale. It was developed by Felix von Luschan in 1927 as a tool to assess racial classifications according to skin color. The Munsell color chart was created before the Von Luschan scale and combined the art and science of color into a single color theory. More recently, the Color Bar Tool was developed by dermatologists in 2015.
Other scales developed recently to address the bias of previous scale to lighter skin tones that are widely used include the Massey-Martin Scale and Project on Ethnicity and Race in Latin America (PERLA) chart. The Massey-Martin Scale (also known as the New Immigrant Survey or NIS Skin Color Scale) is an 11-point scale, ranging from zero to 10, which was created to assess skin color. The PERLA color palette was developed specifically for Latin America usage and has 11 colors.
 The PERLA Color Palette
With an appropriate means of visually classifying different skin colors and tones, the next step involves sensors and instruments to measure them. Part 2 will provide information on this aspect.